Every time a heavy spring rain hits our area, the calls start coming in. County Road 2030 is underwater... again. For our local road commission, it's a costly, frustrating cycle of repairs and closures. As a geospatial engineer, I knew there had to be a way to move from reacting to these washouts to predicting them.
Can we use freely available elevation data and open-source Python tools to pinpoint why certain areas are so vulnerable? The answer is a definitive yes.
This article outlines the journey of building a fully automated hydrologic analysis workflow. We'll go from a simple set of coordinates to a sophisticated understanding of our landscape's drainage patterns, hitting a few technical roadblocks along the way and engineering the solutions needed to create a powerful, predictive tool.
The Game Plan: An Automated Hydrologic Workflow
To tackle this problem systematically, I designed a four-stage workflow that could be run programmatically for any area of interest. The goal was to use an entirely open-source Python stack, making the solution accessible, scalable, and free from licensing constraints.
Here’s the high-level architecture:
- Automated Data Acquisition: The process starts by automatically downloading high-resolution Digital Elevation Model (DEM) data from the USGS 3D Elevation Program using the seamless_3dep library.
- Core Hydrologic Processing: Using the pysheds library, the raw DEM is conditioned to be hydrologically correct by filling sinks and depressions. From there, we calculate the two most critical raster layers: Flow Direction and Flow Accumulation.
- Stream Network & Pour Point Analysis: With our core rasters, we identify stream channels by setting a flow accumulation threshold. Then, using the networkx library, we perform a graph analysis on the stream network to find all the critical junctions and termini (the "pour points") where water converges.
- Watershed Delineation: Finally, we use our pour points as inputs to delineate all of the contributing sub-catchments, giving us a complete map of how water flows across the landscape.
The Roadblock: When Good Libraries Go Stale
When I first tried running the analysis, I hit a wall. PySheds, a fantastic and highly efficient library for this work, started throwing a cryptic error: TypeError: can_cast() does not support Python ints....
This is a common challenge in the fast-moving world of open-source software. The library hadn't been updated to keep pace with fundamental changes in its core dependencies, numpy and numba. The root cause was a change in how numpy, the bedrock of scientific Python, handles data types. The old way was more lenient; the new way is stricter to prevent bugs, but it broke older code that hadn't been updated.
The Fix: A Necessary Fork in the Road
Instead of abandoning a powerful library, I embraced a core tenet of the open-source community: if it's broken, you can fix it. I created a personal fork of the pysheds project and applied the necessary patches to make it compatible with modern versions of its dependencies. This involved updating function signatures to be more explicit about data types, resolving the ambiguity that caused the errors.
It's a common practice, and while it adds an extra step to the setup, it allows us to continue using valuable tools while contributing to the ecosystem. I may submit these changes back to the original project as a pull request to help other users if the owner becomes available. For now, my workflow uses this corrected, stable version.
The Payoff: Visualizing the "Why" Behind the Washout
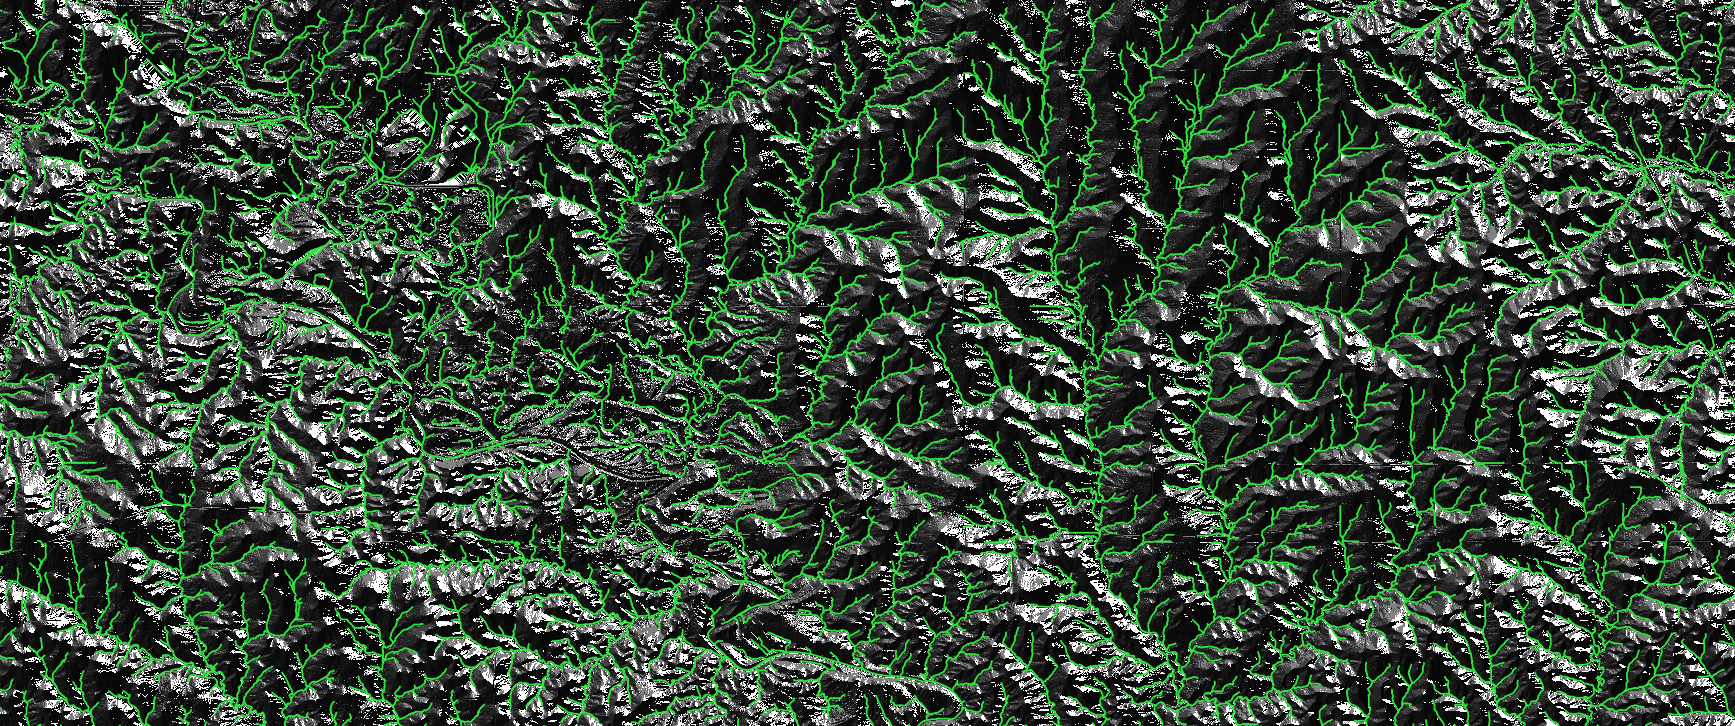
With the workflow running smoothly, the "why" becomes crystal clear. By visualizing the final delineated sub-catchments over the landscape, we can see the story of our watershed.
The analysis reveals the complex hydrography that plague 2030 road. The problem isn't just a single undersized culvert; it's that a significant stream runs parallel to the road for nearly a quarter-mile before joining a larger river. The analysis shows that this confluence, just upstream of the main river, acts as a natural bottleneck. During heavy rain, the river's higher water level effectively dams the tributary, forcing water to back up and spill over 2030 road. This insight is invaluable, shifting the conversation from "let's patch the shoulder again" to "we need to re-evaluate the entire drainage system at this confluence."
The Next Frontier: From Watersheds to Flood Inundation Maps
Now that we know where the water is coming from, can we predict how deep it will get?
This is the next logical extension of the project. By combining the stream network with the high-resolution DEM, we can model potential flood inundation levels for different rainfall scenarios (e.g., a 25-year or 100-year storm). This moves the analysis from a powerful diagnostic tool to a true predictive mitigation platform, allowing planners to visualize risk and test the effectiveness of proposed infrastructure changes before breaking ground.
Conclusion
Open-source tools, when wielded with engineering expertise and a bit of persistence, are powerful enough to solve complex, real-world infrastructure problems. This workflow provides a robust, repeatable, and scalable method for understanding the hydrology of any landscape.
You can find the complete, working code for this analysis, including the setup for the patched pysheds library, on my GitHub repository.
Frequently Asked Questions (FAQ)
1. What exactly causes the TypeError with PySheds, and is your fix the only way?
The error TypeError: can_cast() does not support Python ints... happens because newer versions of the numpy library (a core dependency) became stricter about how they handle converting between different numerical data types. The original pysheds code was written before this change. My fix, which involves forking the library and updating the code to be more explicit about data types, is a common way to resolve these kinds of dependency issues in the open-source world. It ensures the library can run smoothly with modern tools.
2. Why build this in Python instead of just using ArcGIS Pro or QGIS?
While desktop GIS software is incredibly powerful for interactive analysis, a Python-based workflow offers three key advantages: Automation, Repeatability, and Scalability. Once the script is written, I can run the entire analysis for any number of different areas with a single command, without a single mouse click. Every analysis is performed exactly the same way, ensuring scientifically rigorous and repeatable results. Furthermore, this script can be deployed on a cloud server to analyze vast areas far more efficiently than would be possible on a desktop machine. And I actually use QGIS to visualize all of the data currently after the tool runs.
3. Where does the elevation data come from, and is it free?
Yes, the data is completely free and publicly available. The workflow automatically downloads the Digital Elevation Model (DEM) data from the USGS 3D Elevation Program (3DEP). This is a fantastic national resource that provides high-resolution elevation data for the entire United States, making this type of analysis accessible to everyone.
4. How do you determine the right "stream threshold" for the analysis?
The stream threshold (the value used to decide where a stream officially begins) is a critical, user-defined parameter. There's no single "correct" answer; it depends on the goals and the landscape. A low threshold (e.g., 1000) will generate a very dense network of tiny gullies, useful for detailed site analysis. A high threshold (e.g., 20,000) will only show major rivers. For this analysis, I chose a value of 5000 for a 10-meter DEM, which defines a stream as forming after it drains 0.5 square kilometers. It's often a process of experimentation to find the value that best represents the real-world stream network for your specific area. I still have some tweaking to do if you look at our stream network, there are currently still some broken connections.
5. How is this analysis different from an official FEMA Flood Insurance Rate Map (FIRM)?
This is a very important distinction. My analysis is a hydrologic model that shows where water will flow and accumulate based on topography. It's excellent for identifying contributing areas and potential problem spots. An official FEMA FIRM is a far more complex hydrologic model. It incorporates detailed engineering studies, historical flood data, and statistical analysis of storm events (e.g., the "100-year flood") to legally define flood risk zones for insurance and regulation purposes. My workflow can be seen as a powerful first step to diagnose watershed behavior, while a FEMA map is the official regulatory end-product.